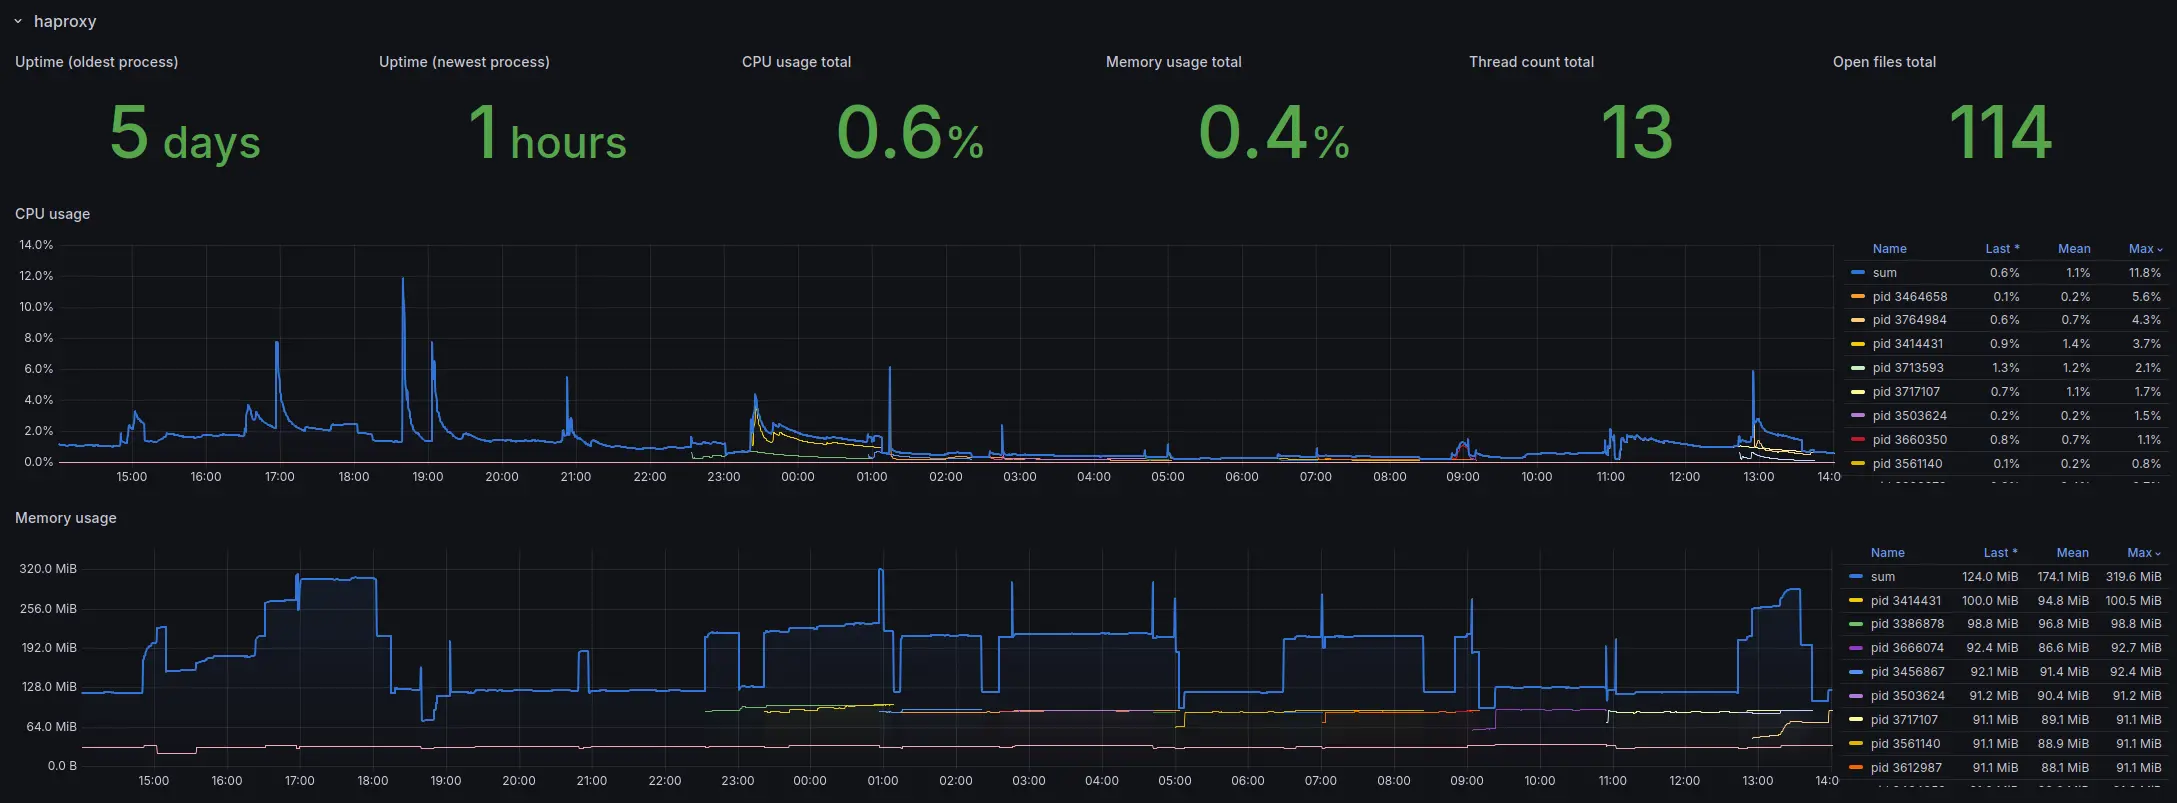
Prometheus Process Exporter
A Prometheus exporter that monitors system processes and exports metrics about their resource usage.
Features
- Monitors multiple processes by name
- Exports comprehensive metrics including:
- CPU usage percentage
- Memory usage (RSS and percentage)
- Uptime in seconds
- Open file descriptors
- Thread count
- Resident and virtual memory sizes
- I/O counters (read/write bytes)
Installation
Binary
Process exporter has prebuilt binaries for Linux and macOS on amd64 and arm64.
You can install it easily by using these commands:
wget https://git.rznet.fr/tchivert/prometheus-process-exporter/releases/download/latest/process-exporter-<os>-<arch> -O /usr/local/bin/process-exporter
chmod +x /usr/local/bin/process-exporter
Exemple for an amd64 linux machine:
wget https://git.rznet.fr/tchivert/prometheus-process-exporter/releases/download/latest/process-exporter-linux-amd64 -O /usr/local/bin/process-exporter
chmod +x /usr/local/bin/process-exporter
Debian-based distributions
You can install process exporter by downloading directly the latest .deb:
wget https://git.rznet.fr/tchivert/prometheus-process-exporter/releases/download/latest/process-exporter-amd64.deb
sudo dpkg -i process-exporter-amd64.deb
Configuration
The exporter uses YAML configuration format, which is the standard for Prometheus exporters.
Create a config.yml file with the processes you want to monitor:
# Prometheus Process Exporter Configuration
# YAML format - recommended for Prometheus exporters

# List of processes to monitor
processes:
  - nginx
  - haproxy
  - postgres
  # - mariadb
  # - redis
Configuration Options
processes: List of processes to monitor (required)- Can be specified by name only:
- nginx - Can be specified by name and PID:
- name: haproxy pid: 516525
- Can be specified by name only:
interval: Metrics collection interval (optional, e.g.,5s,1m,30s). If not specified, defaults to 10 seconds. Set to0sfor on-demand collection only.- Comments can be added using
#prefix - YAML supports multi-line arrays for better readability
Example with Interval Configuration
# Prometheus Process Exporter Configuration
processes:
  - nginx
  - haproxy
  - postgres

# Collect metrics every 30 seconds
interval: 30s
Example with More Processes
processes:
  - nginx
  - haproxy
  - postgres
  - mysql
  - redis
  - docker
  - node_exporter
  - prometheus
Example with PID-based Monitoring
You can monitor specific processes by their PID:
processes:
  - name: haproxy
    pid: 516525
  - name: nginx
    pid: 12345
  - postgres
This configuration will:
- Monitor the specific haproxy process with PID 516525
- Monitor the specific nginx process with PID 12345
- Monitor all postgres processes by name
Example with Mixed Configuration
# Prometheus Process Exporter Configuration
processes:
  - nginx
  - name: haproxy
    pid: 516525
  - postgres
  - name: custom-app
    pid: 98765

# Collect metrics every 30 seconds
interval: 30s
Usage
Usage of ./process-exporter:
  -c string
        Path to configuration file (default "config.yml")
  -l string
        Address to listen on (default ":9064")
  -v    Enable verbose logging
Metrics
The exporter provides the following metrics:
process_cpu_usage_percent: CPU usage percentage (labels: process_name, pid)process_memory_usage_bytes: Memory usage in bytes (labels: process_name, pid)process_memory_percent: Memory usage percentage (labels: process_name, pid)process_uptime_seconds: Process uptime in seconds (labels: process_name, pid)process_open_files: Number of open file descriptors (labels: process_name, pid)process_thread_count: Number of threads (labels: process_name, pid)process_resident_memory_bytes: Resident memory size (labels: process_name, pid)process_virtual_memory_bytes: Virtual memory size (labels: process_name, pid)process_read_bytes_total: Total bytes read (labels: process_name, pid)process_write_bytes_total: Total bytes written (labels: process_name, pid)
Prometheus Configuration
Example Prometheus configuration:
- job_name: process
    scrape_interval: 10s
    static_configs:
      - targets:
        - <hostname>:9064
    relabel_configs:
      - source_labels: [ __address__ ]
        target_label: instance
        regex: '(.*):9064'
        replacement: '${1}'
Running as a Service
You can create a systemd service file to run the exporter as a service:
[Unit]
Description=Prometheus Process Exporter
After=network.target

[Service]
User=prometheus
ExecStart=/usr/local/bin/process-exporter -c /etc/default/process-exporter
Restart=always

[Install]
WantedBy=multi-user.target
License
This project is licensed under the MIT License. See the LICENSE file for more information.
